Dell
MATLAB Deep Network Designer Application
The Deep Network Designer is a desktop application that allows users to visualize and build deep neural networks. At the time of the beginning of this project, the tool was in a light MVP state to validate business hypotheses and confirm technical feasibility. It was initially released without any GUI features, and was only meant to support work on deeper architectures in the most minimal way, offering only hard coding and command line methods for importing, creating and editing networks.
My job as the designer was to create a robust application which offered users an interactive, visual interface as the primary means to work with their networks.
Deliverables
Adobe Illustrator handoff file with specifications, prepared and packaged icon files, prepared and packaged start screen illustrations
Core Team
Senior Designer (Me), Development Lead, Engineer (SME), UX Researcher
Background
Business Goals
The creation of this application was given the highest priority ranking, as stakeholders recognized the large user demand for the current tool, and the overwhelming request to elevate the functionality and ease of use.
Additionally, at the time of this work, deep and machine learning was surging for a broad array of use cases, such as robotics, healthcare, and image recognition; providing our users with the ability to stay relevant and able within our software was imperative.
User Pain Points
We were able to collect a large amount of feedback on the current version and found a handful of common pain points:
Inability to visualize a network, causing tedious code sorting to find where to apply changes
Creating networks from scratch was complex and beyond the skill level of our novice and intermediate personas
Editing during transfer learning was time consuming, taking away from training and educating networks at a faster rate
There was no efficient way to inspect large structures of data, apart from the command line, increasing network bias and error
The overall workflow was cumbersome; the workflow involved many disconnected steps and context/window switching
Outcome Overview
Qualitative successes:
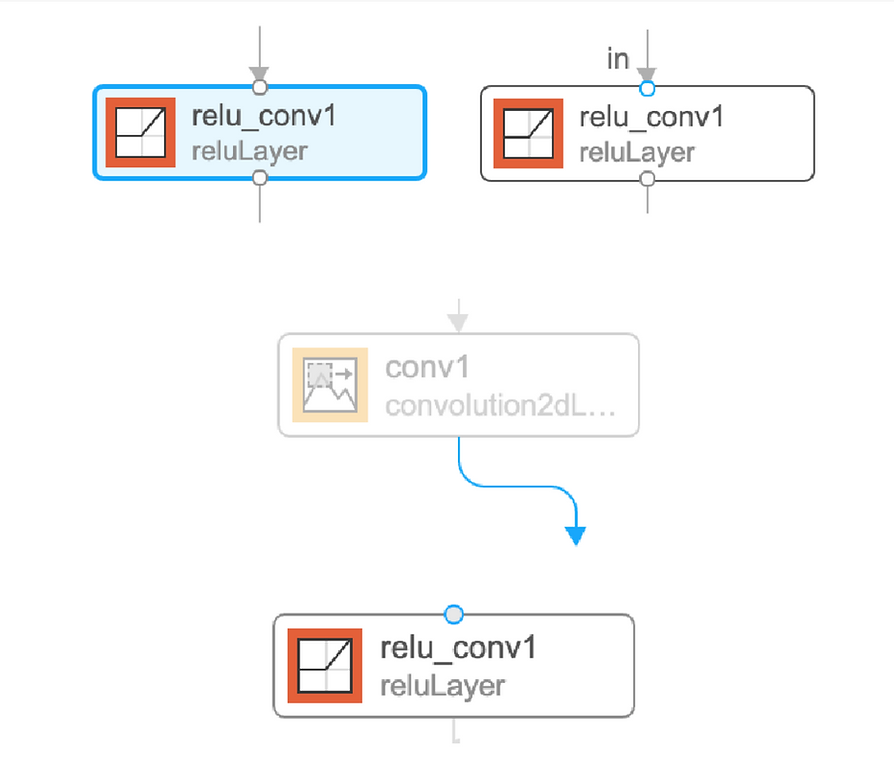
Users raved about the ease of use of the GUI drag and drop feature for building a network and adding new layer blocks
Very few users needed code to support them in their initial workflow steps, and primarily only used code toward the end to validate details of their network
Users were confident that they did most of the tasks correctly, and that they would be able to do them again
Users felt the application behaved as expected and aligned with the quality of other MathWorks applications
Quantitative successes
An excellent SUS score of 95% (75 or higher being the goal)
A 100% net promotor score (40% or higher being the goal; being a new application we lowered our baseline to under 50%)
An 8 out of 10 ease of use score
Users learned the fundamentals of using the application in an average of 7 minutes
Users were able to start creating a network from scratch in an average of 3 minutes from entering the app
Users were able to import and start editing a network in an average of 3 minutes from entering the app
Users were able to complete editing a network and have it ready for training nearly 300% faster than with the MVP version of the tool
Design Process
Research
We used various methods to collect our research
Internal tool which collected user documented feedback and issues
Internal benchmarking of other MathWorks software visualizations
External benchmarking of neural network diagrams and industry standards for these
Competitive analysis (at the time, we found no direct competitors for this specific use case
Ideation
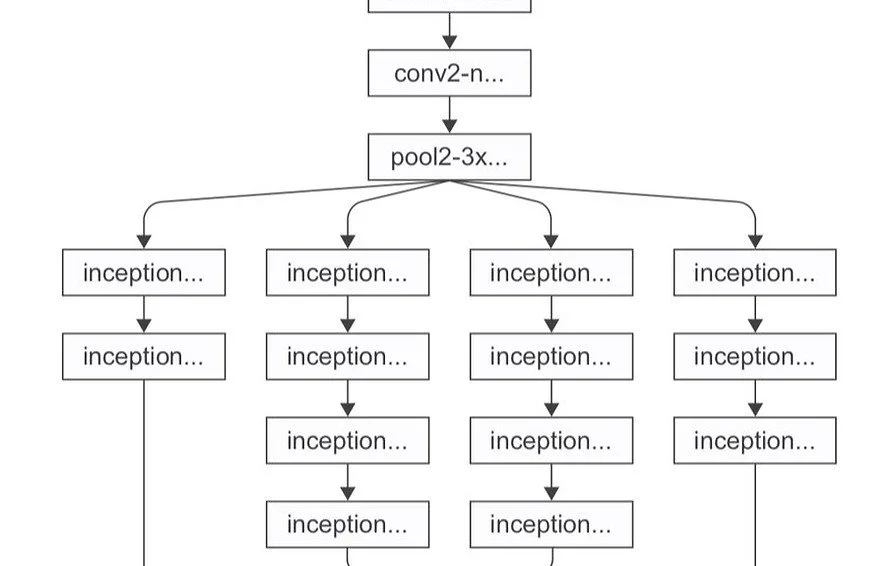
We hadn't looked far when we decided that using a GUI drag and drop experience would make the overall experience intuitive and simple. Several of our internal benchmarks used a drag and drop interface for building models and user-authored applications and this design case felt comparable. To ensure accuracy of concept, we focused most of our brainstorming on how to represent each part of the network in an accessible, recognizable way.


Framing
To bring everything together into high fidelity mockups, I reused components from our design system and stayed consistent with our standardized UI container. After enriching core elements like the start screen experience, drag and drop GUI, iconography design, taxonomy and color usage, I refined smaller details such as micro interactions, revising network layer data, and visualization tools.
Testing
In preparation for bringing our early designs to stakeholders, we did rapid hallway testing to get quick reactions and gauge impact. For more robust feedback on later designs, I created an interactive prototype to test with both internal and external users. We looked at how quickly and confidently a user could build a custom network without the use of code, how users perceived the learning curve of the app, and how quickly they could navigate its various capabilities to find what they needed.
These key indicators, among feedback from specific activity-based tasks, plus a design review with our stakeholders, allowed us to validate the design and iterate where needed in preparation for implementation.


Impact
One of the main reasons why this project was successful is because we took time to research, benchmark, conceptualize, and discuss our design and processes. I worked with a team in the UK and was the only remote contributor at the time. I ensured that the time difference and remote factor did not limit our communication or collaboration, and we set cadences and milestones early.
Future Planning
Creating a new application was a large undertaking, especially for such a small team. We had to adhere to our 'must have' requirements, which meant leaving some features behind for V1 and saving them for the next version. Some of these included showing trained vs. untrained layers, varying the granularity of information when zooming in and out, and the addition of cleaning data and training networks within the app (activating the 'data' and 'training' tabs within the workspace).