MathWorks
MATLAB Charting and Graphics
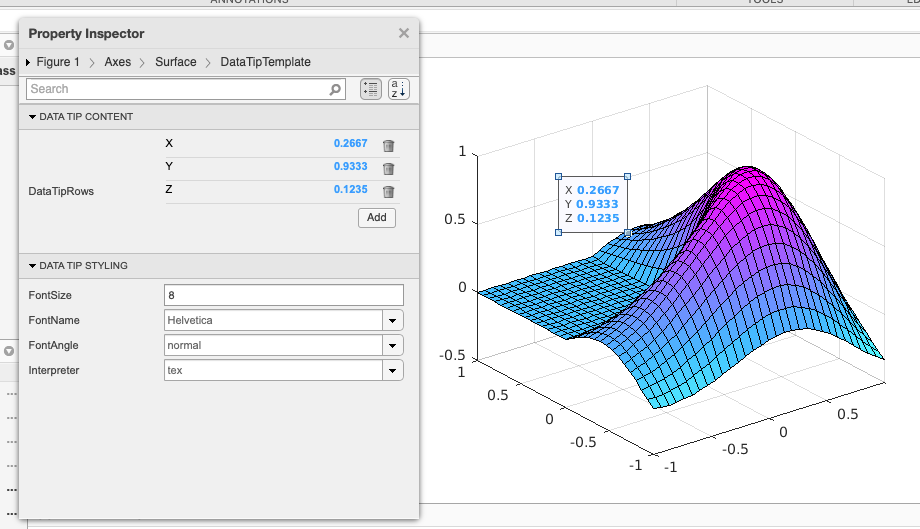
MATLAB graphics is a collection of visualization standards for the charts a user can render with MATLAB code. Over the course of multiple years, I was the embedded designer on the graphics team at MathWorks and my role was to support the team in creating and continuously improving the default elements for these charts.
Deliverables
Adobe Illustrator files for documentation chart redesigns; design specifications for redesigned chart elements, SVG files for icons,
Core Team
Designer (Me), UX Researcher, Development led, Team of developers
Background
Userbase
Our users were extremely diverse in their application of MATLAB graphics. Everything from their use cases to their experience and skill level with our software varied and was unpredictable.
The one thing our users shared in common was the highly technical nature of their charting needs. Because of this, it was imperative to design with accuracy and accessibility in mind and truly let function drive form.
Limitations
This work came with many challenging and limitations over the course of my time with the team, many which we overcame but several that required work arounds
Archaic implementation technology
Lack of alignment and contradicting opinions among SMEs and team members
Charting and application frameworks were inconsistent and disconnected
Emergence of charting on Apple operating systems
A long-standing team that was not used to change or design influence
Outcomes Overview
Design Accomplishments
During my time with the team we made many key accomplishments that helped successfully steer the future of MATLAB graphics:
Cohesively redesigned more than 30 charting elements (tick marks, tool tips, axis, grid, spacing, typography, legends, toolbars, plot lines, points, etc)
Introduced 6 new chart types, using the redesigned elements
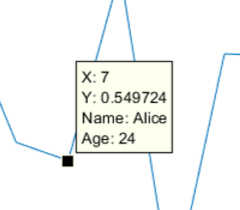
Added more than a half dozen new interactive features to the charting GUI
Removed 2 archaic technologies and replaced these with ones that were consistent and compatible with modern areas of the software
Contributed data visualization standards to the design system and online documentation
Provided more flexibility for users to customize their charting outputs
User Outputs
To test our redesigned charting elements, we did both moderated user testing with a large group of internal SMEs, and beta testing within the live product. We saw various successful metrics as outputs:
Increase in charting speed and graphics performance by nearly 60%
Reduction in charting and interpretation errors by nearly 30%
Adoption rate of new elements was 78% (users had to download the upgrade voluntarily)
Users chose to chart their data sets 25% more than before the updates
Increase in users sharing, saving and publishing their charts by 12%
Before

After

Before
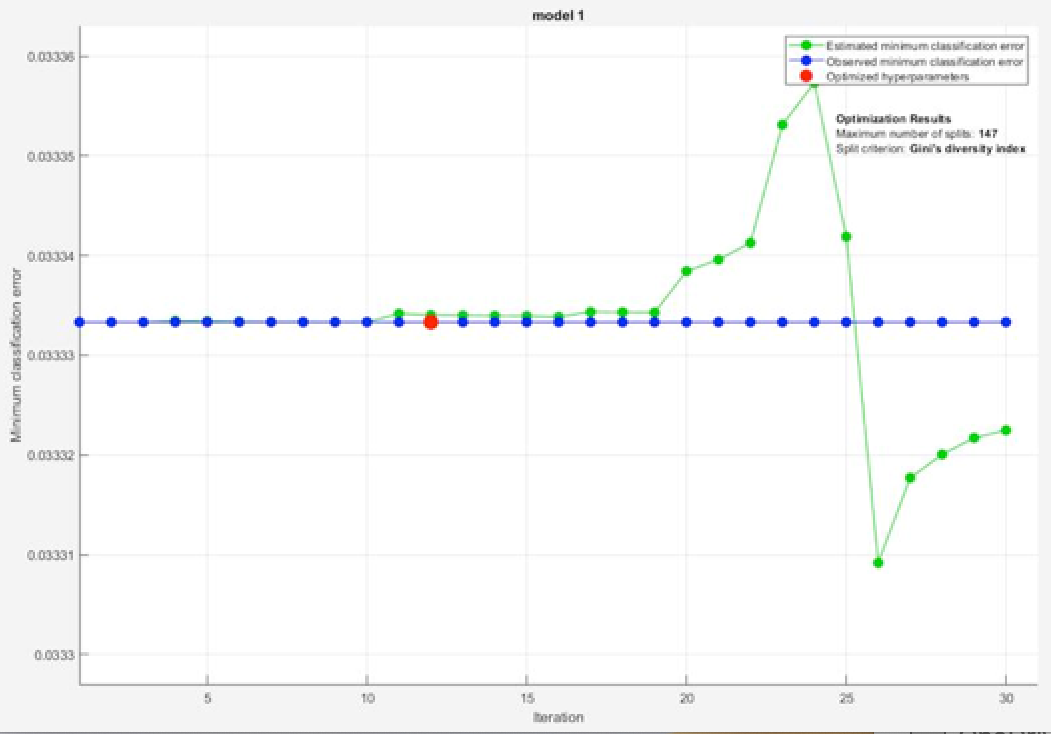
After
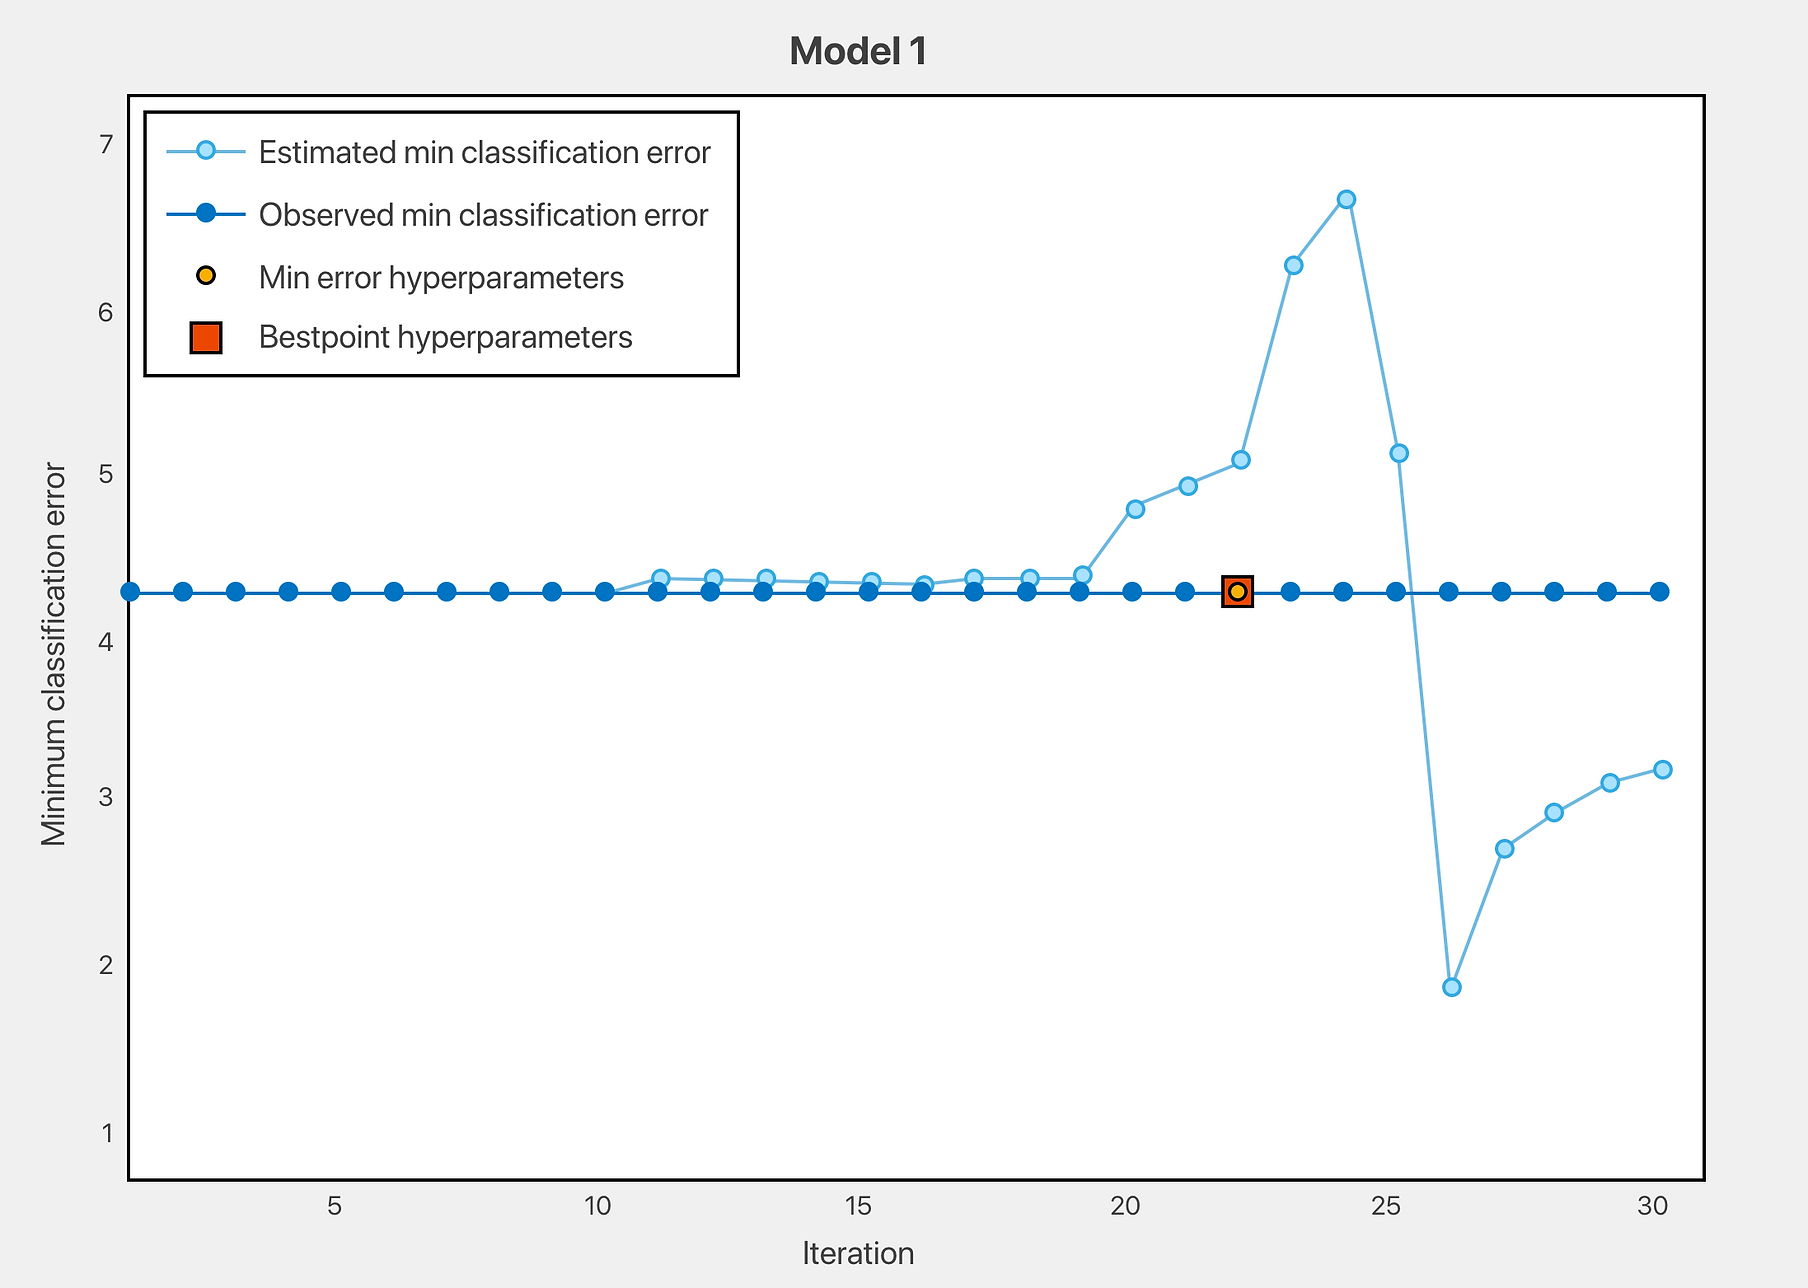
Before

After

Before
After

Impact
To continuously make forward progress, over time, I became an expert in the technologies and history of MATLAB graphics. This allows me to best understand what design decisions were feasible and why. It also allowed me to effectively negotiate with the team and create a culture of flexibility and communication where design was valued and truly embedded.
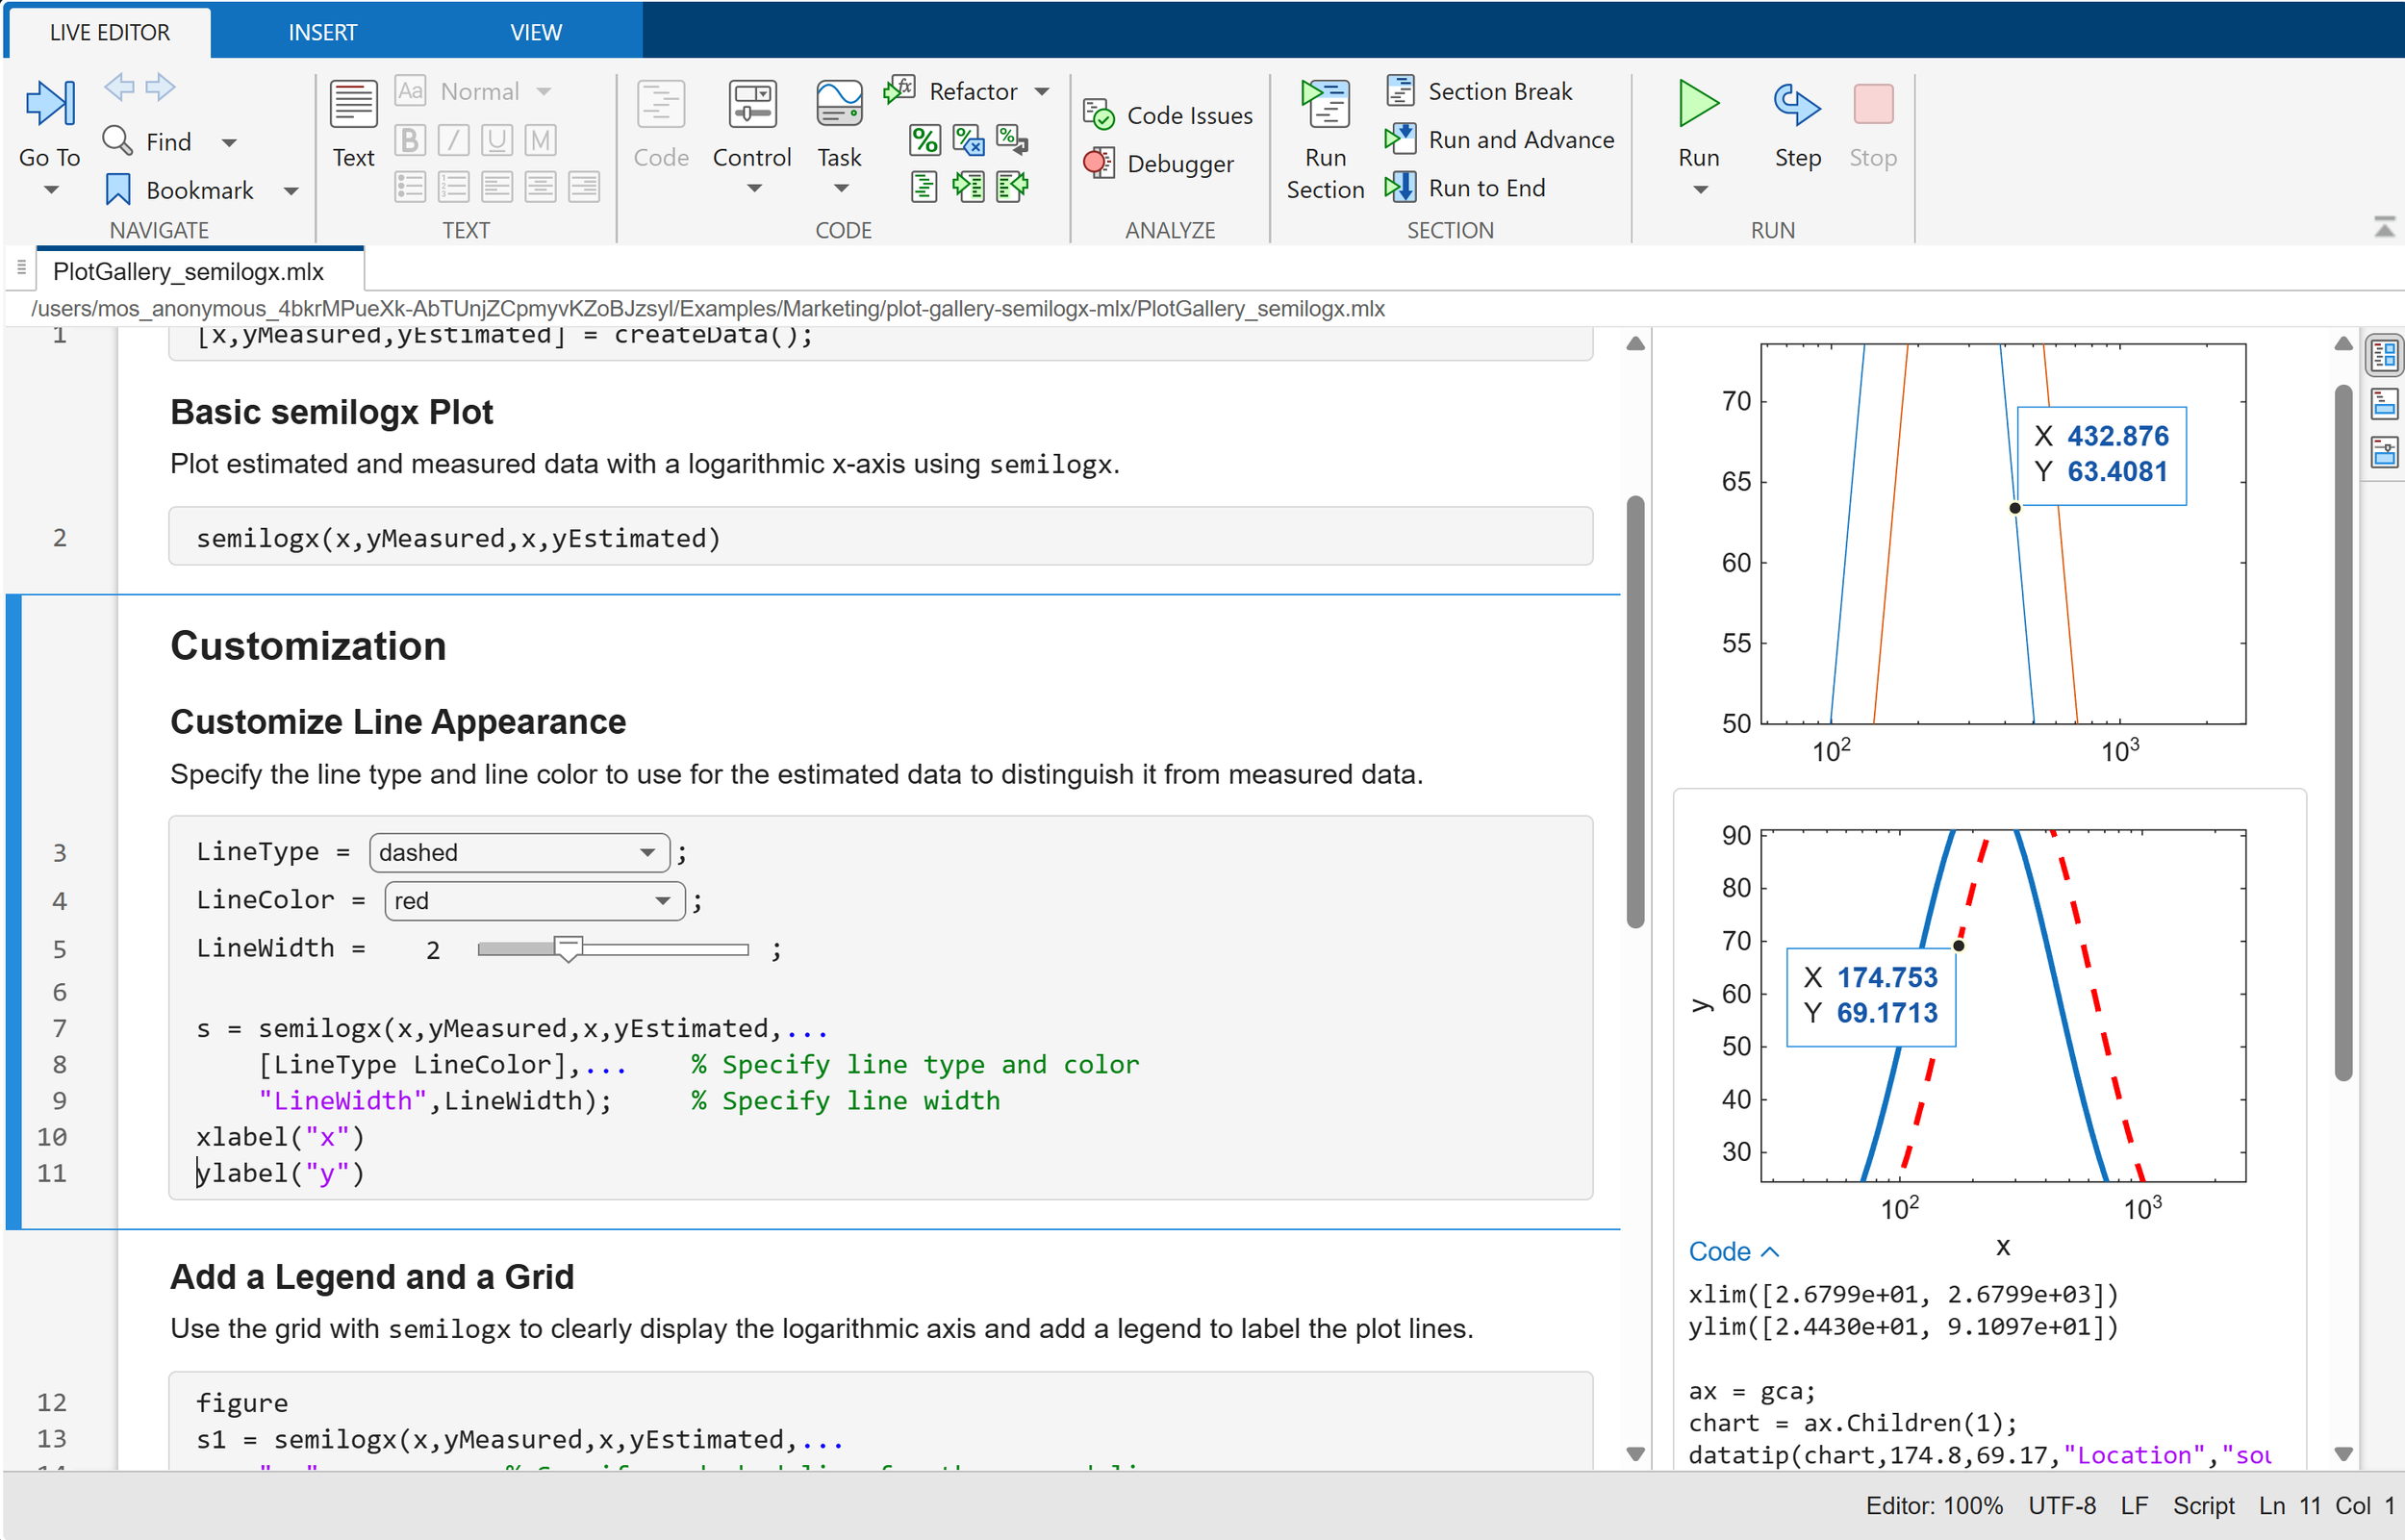
Additionally, I advocated for an initiative to update the Figure window and align it's frameworks with the ones we used for our larger applications, a multi-year strategy that led to charts being embedded in today's MATLAB LiveEditor.